


How to Find Your Browser Developer Console

Jeremy Morgan 
Mar 22, 2020 - 2 min read
Last Update: Jun 7, 2024

AI changed software development. This is how the pros use it.
Written for working developers, Coding with AI goes beyond hype to show how AI fits into real production workflows. Learn how to integrate AI into Python projects, avoid hallucinations, refactor safely, generate tests and docs, and reclaim hours of development time—using techniques tested in real-world projects.
Debugging web applications can be tricky. Accessing your browser’s developer console is the easiest way to “pop the hood” and see what’s going on with your application. It’s like a secret backdoor that isn’t very secret.
Google Chrome
Google’s browser is one of the most popular out there, and it’s easy to access the developer console:
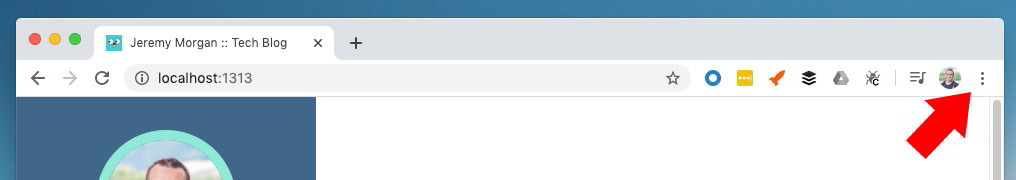
In the upper right hand corner of the browser, click the 3 dots:
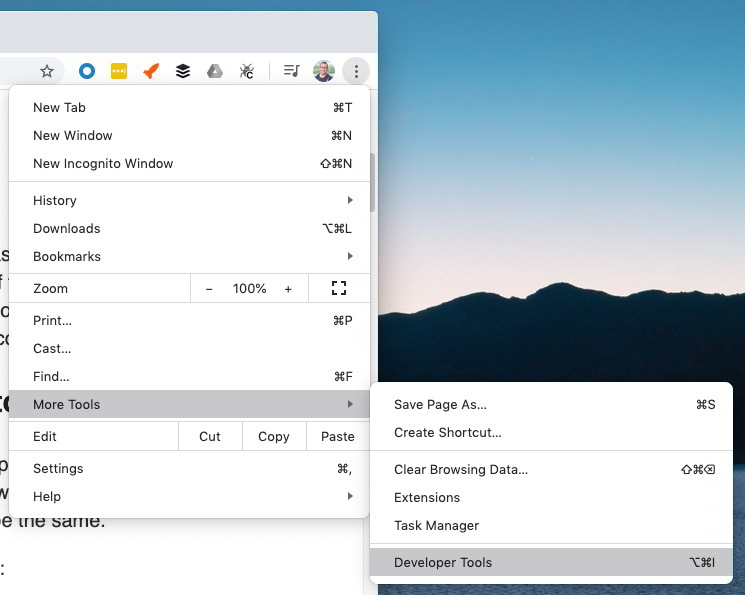
Then select More Tools -> then Developer Tools
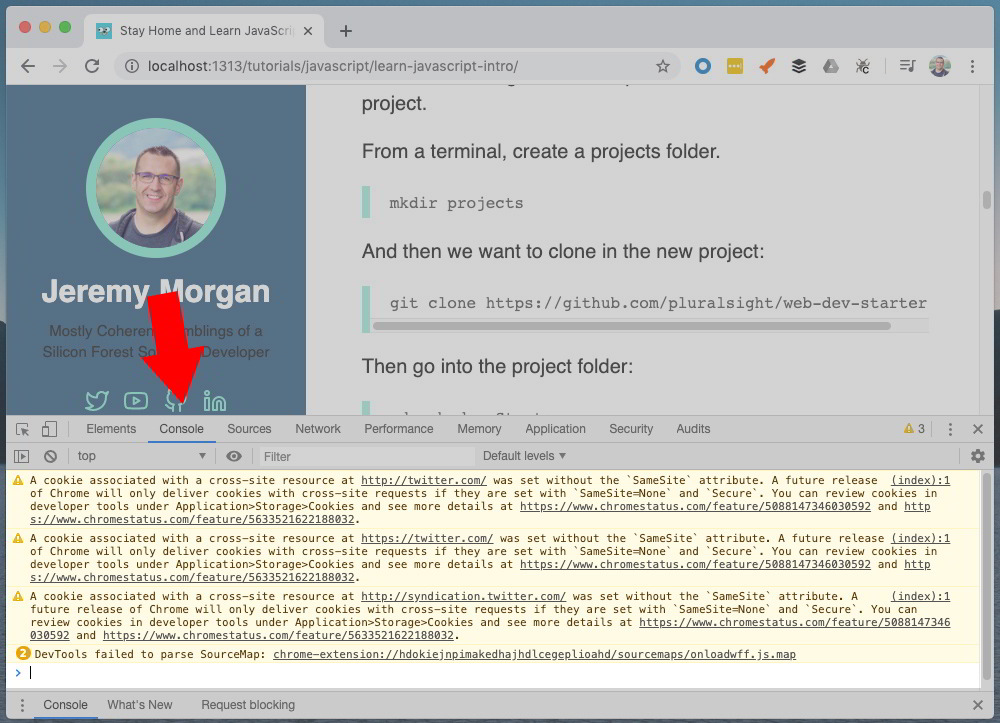
You will now see the console (and all the errors my site produces when I run it locally)
Shortcuts:
MacOS: Option + ⌘ + J Windows / Linux: Shift + CTRL + J
Safari
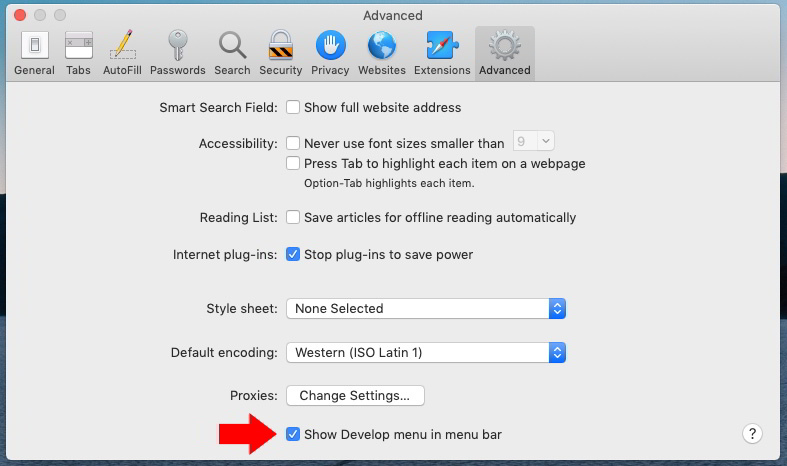
In Safari you’ll need to enable Developer mode. Go to the
Select Safari Menu > Preferences and make sure “Show Develop menu in menu bar” is checked:
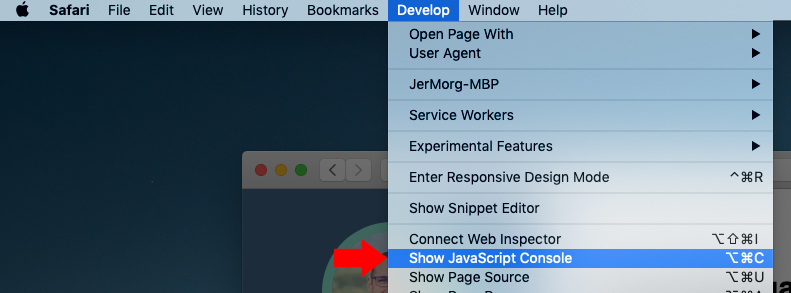
Now you’ll see a developer option on the Safari menu bar:

Select “Show JavaScript Console”
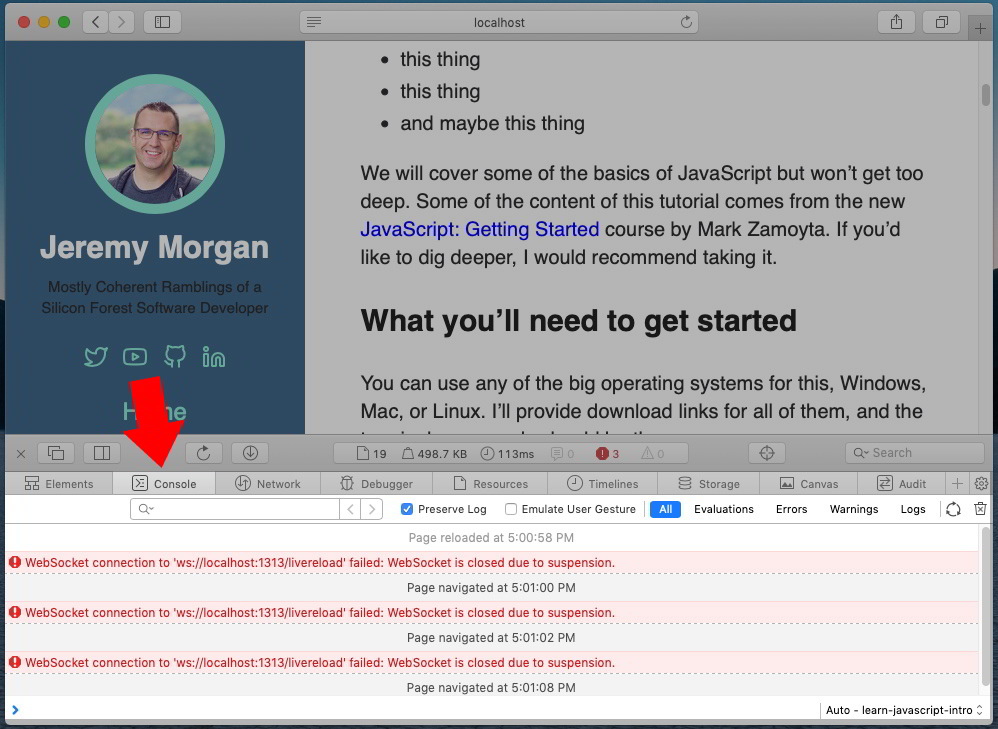
And now you’ll see a web console in Safari:
Shortcuts:
Option + ⌘ + C
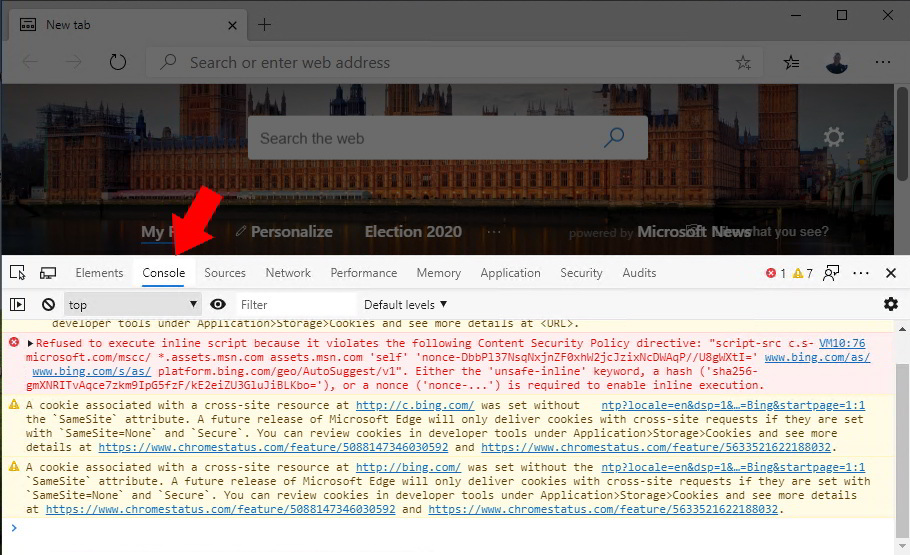
Microsoft Edge
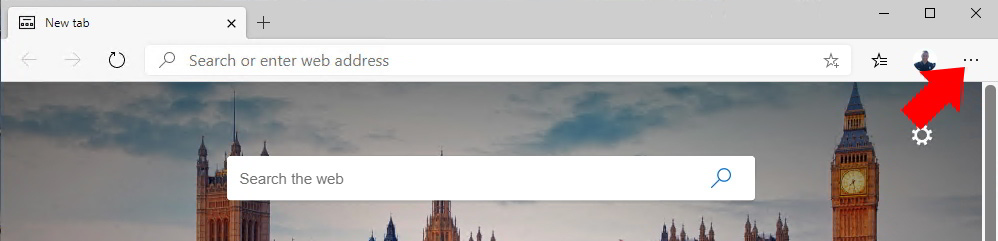
In Edge, again click the three dots in the upper right hand corner:
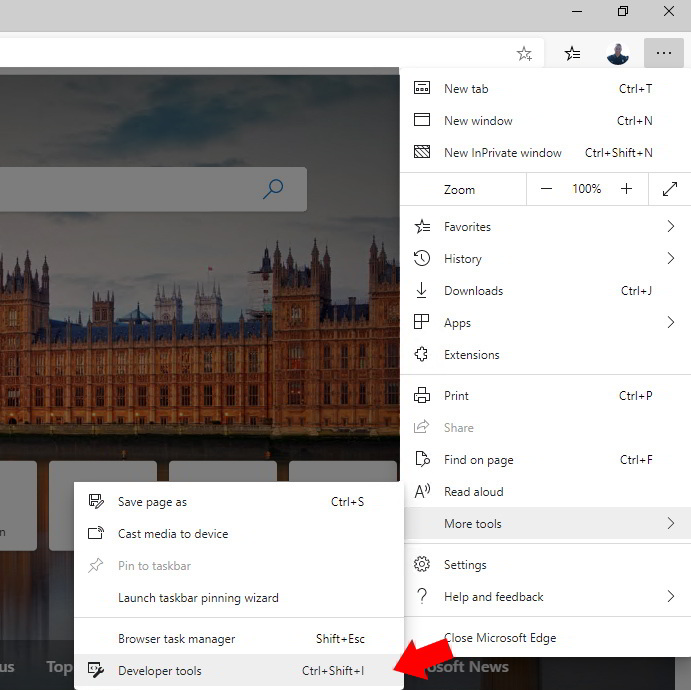
Select More Tools -> Developer Tools
And you’ll see a lovely console which hopefully doesn’t look like Bing’s:
Shortcuts:
Windows: F12
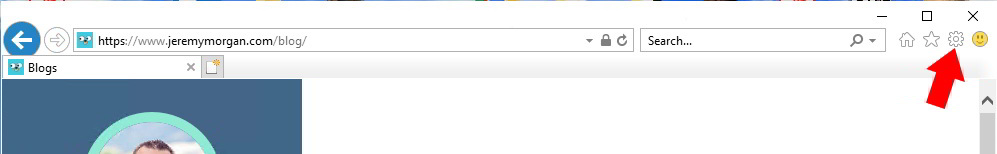
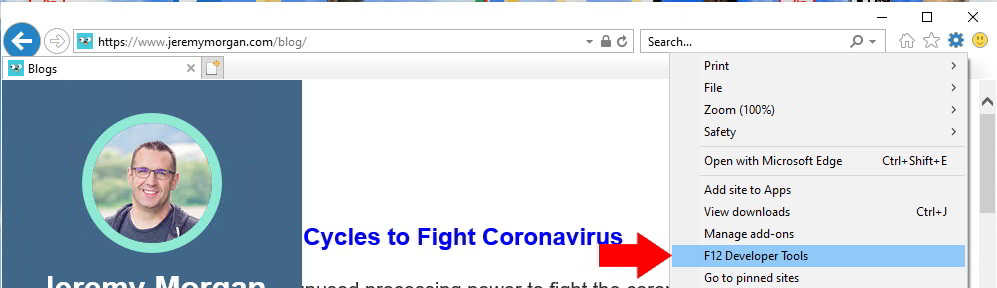
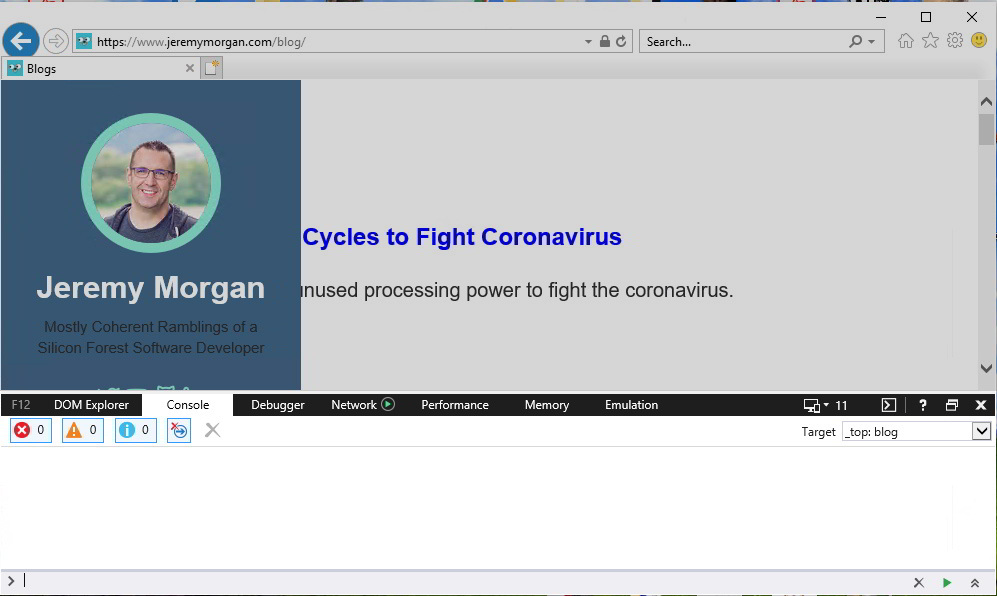
Internet Explorer
In Internet Explorer click on the gear icon at the upper right hand corner of the browser:
Select “F12 Developer Tools” (or, ya know, press F12)
And your console appears:
Shortcuts:
Windows: F12
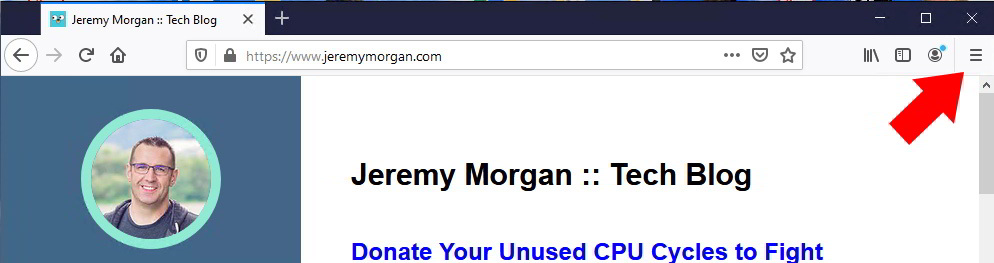
Firefox
In Firefox you’ll have a sandwich menu in the top right hand corner:
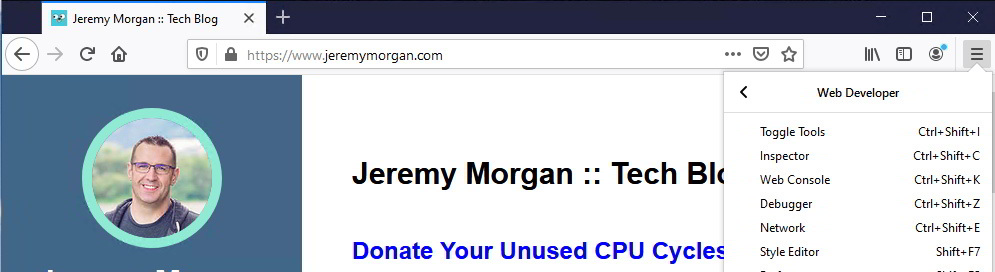
Clic that and select Web Developer -> Web Console
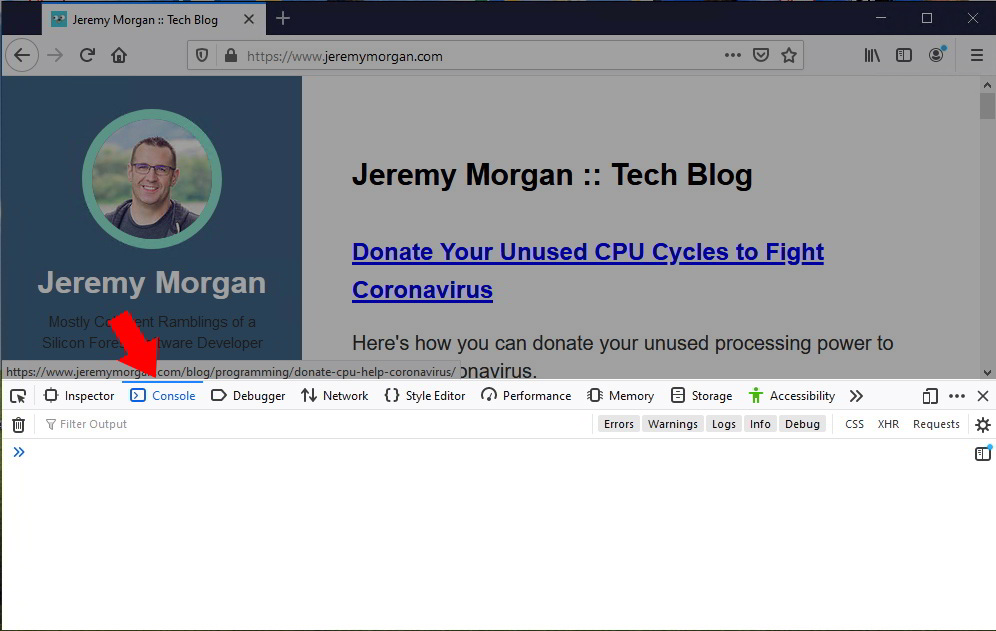
And your console appears!
Shortcuts:
MacOS: Shift + ⌘ + J Windows / Linux: Shift + CTRL + J
Summary
This is a list of ways to get into the developer console for popular browsers, and it’s a great way to debug your JavaScript applications. I can’t stress it enough to new developers: use your console that’s why it’s there. It will save you heaps of time and effort.
Questions, comments? Let me know!

Skip the hype. The newsletter that keeps you in the know.
AI news curated for engineers. The AI New Hotness Newsletter is what you need.
Zero fluff. Just the research, tools, and infra updates that actually affect your production stack.
Stay up to date on AI for developers - Subscribe on LinkedIn