


Visualize Your SQLite Data Effortlessly with Python and Matplotlib

Jeremy Morgan 
Mar 27, 2023 - 13 min read
Last Update: Mar 27, 2023

AI changed software development. This is how the pros use it.
Written for working developers, Coding with AI goes beyond hype to show how AI fits into real production workflows. Learn how to integrate AI into Python projects, avoid hallucinations, refactor safely, generate tests and docs, and reclaim hours of development time—using techniques tested in real-world projects.
Greetings data junkies! We’re going to do another cool project with Python. Today I will show you how to draw graphs with Python and Matplotlib. Not only that but we’re going to use a SQLite (my favorite) database to back it all. So we’ll load data into a database and pull it back out and make awesome graphs with it, all with Python.
What we’re doing in this tutorial
- Setting up our Python Environment
- Getting statistical data and putting it into .CSV files
- Loading those CSV files into tables in SQLite with Python
- Pulling that data from SQLite into Matplotlib:
- Displaying graphs for the results
For this tutorial, you will need:
- A computer with Python installed on it
- a SQLite Database Explorer (optional, but handy)
- Some data (you can use mine)
So let’s get started.
We’re using two technologies here: Matplotlib and SQLite. We’re gluing them together with Python. I’ll explain in depth what these technologies are. You can skip it if you want to dig into the code.
What is Matplotlib?

Matplotlib is a Python plotting library. It lets you create static, animated, and interactive visualizations from data. It’s perfect for what we’re doing today. Matplotlib is one of Python’s most popular data visualization libraries, and for good reason.
Matplotlib is super useful. Some of the cool stuff it does:
Data exploration: By creating visual representations of your data with Matplotlib, you can explore and understand the data in a way that’s impossible with just numbers and text.
Data presentation: With Matplotlib, you can customize and format your visualizations easily, making it a great tool for creating presentations, reports, and other documents.
Data analysis: It’s a great tool for making graphs and plots, like line plots, bar plots, histograms, and scatter plots.
Research and development: It’s frequently used in scientific computing and research, where data visualization is crucial in understanding and analyzing data.
Matplotlib is a valuable tool for anyone working with data. It provides a powerful and flexible way to visually represent your data. As you’ll see soon, it’s pretty easy to use as well.
What is SQLite?
Ah, good old SQLite is one of my favorite technologies ever. If you read this blog a lot or watch my live streams you know I use it all the time.
SQLite is a lightweight, serverless, self-contained database management system (DBMS). It’s used in various applications, from embedded stuff on your phone to large web applications. It’s perfect for small-scale apps, embedded systems, and situations where a full-fledged database server isn’t needed.
Here are some key reasons why you should consider using SQLite:
Serverless and Self-Contained: SQLite doesn’t require a separate server process to run, which reduces the complexity of setting up and managing a database. You can now put “Able to Install SQLite Servers on any platform” on your resume without lying. It is fully self-contained, which means all database operations are done in the application. You just copy the file into your folder and go.
Lightweight: With a small binary size, SQLite is a great choice for apps with limited storage and memory requirements, such as mobile apps or IoT devices. It’s smaller than your favorite JavaScript framework.
Cross-Platform: SQLite is compatible with various operating systems, including Windows, macOS, Linux, and even Android and iOS. This is ideal developing cross-platform applications.
ACID-Compliant: SQLite follows the ACID (Atomicity, Consistency, Isolation, Durability) properties, ensuring that database transactions are reliable and robust, even in cases of system crashes or power failures.
Easy Integration: SQLite’s C library can be easily integrated with various programming languages, including Python, which we’re using today. This simplifies the process of embedding SQLite in applications. I’ve used it with four or more languages so far.
Zero Configuration: SQLite doesn’t require any external configuration, making it easy to set up and use immediately. Again you just copy a file and go.
Overall, SQLite is an excellent choice for developers looking for a simple, lightweight, and reliable database solution for small-scale applications or situations where a full-scale database server is unnecessary. This is why I use it all the time, any chance I get.
Step 1: Setting up our Python environment
I’m a big proponent of setting up Python virtual environments for everything.
We’re going to set up our virtual environment for this app. I’m using Linux, and these instructions work with Linux and OSX, but if you’re in Windows you can try these instructions. Generally when in Windows I use Ubuntu in WSL, but you have options.
python -m venv benchmarkfun
I named mine benchmarkfun but you can name it whatever you want.
Then, activate it
source benchmarkfun/bin/activate
You should see something like this:
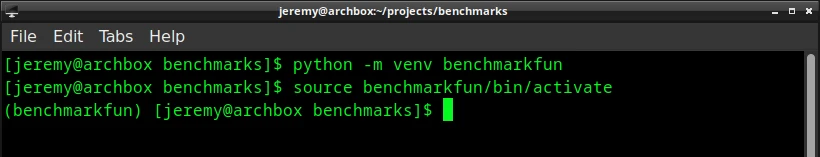
Make sure you have (nameofenvironment) before your prompt.
Then we’ll install Matplotlib.
pip install matplotlib
You don’t need to install SQLite anymore as it’s a part of the standard library. Now you’re ready to go!
Step 2: Putting my Data into CSV Files
I love CSV files and use them any chance I get, and that’s where I’ll put the data at first. So let’s take the data from My article containing benchmarks for the M2 and put it into CSV files.
Since the dataset is so small, I’ll put it here.
First we’ll look at the CPU Tests that are just the M1 vs the M2.
M1 vs M2 Geekbench CPU Test
machine,singlecore,multicore
M1,2105,7795
M2,2650,14217
I’ll name this m1-vs-m2-cpu.csv and put it in my CSV folder of my project.
And on to the next one:
M1 vs M2 Geekbench Compute Test
machine,computescore
M1,19832
M2,49356
I’ll name this one m1-vs-m2-compute.csv.
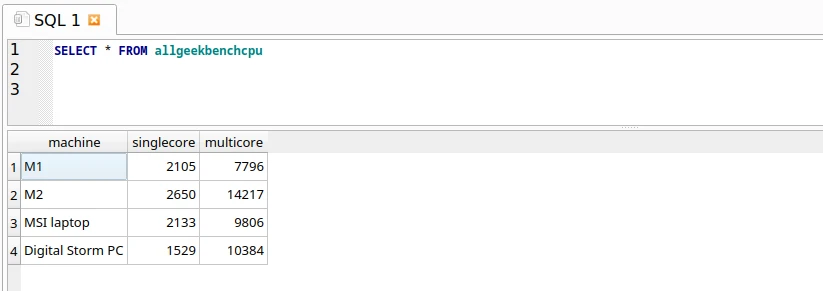
All Machines Geekbench CPU Test
machine,singlecore,multicore
M1,2105,7796
M2,2650,14217
MSI laptop,2133,9806
Digital Storm PC,1529,10384
we’ll name it all-geekbench-cpu.csv
All Machines Geekbench Compute Test
machine,computescore
M1,19832
M2,49356
MSI Laptop,84348
Digital Storm PC,232061
this one will be named all-geekbench-compute.csv.
This is a good sampling of data I want to graph, so let’s get it into a database.
Step 3: Storing the Data in a SQLite Database
Here’s one cool thing about SQLite that I like. To create a new SQLite database, you can use DB Browser for SQLite, create a new database and save it.
Or, you can just call it from your application and if it doesn’t exist it’s created. That’s what we’ll do here.
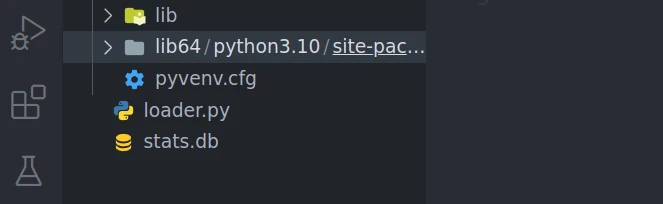
To start off, let’s create a new Python script named loader.py. Add in the following code:
import sqlite3

conn = sqlite3.connect('stats.db')
cursor = conn.cursor()
and run the file.
Hey lookie here! We have a SQLite database.
Perfect! Now, let’s load these .CSV files into their own tables.
To load data into SQLite you need to follow these steps.
- Connect
- Create a Cursor
- Create table with SQL
- Read in data from CSV
- Commit
- Close
We’ll go through all of these steps to load up our .CSV files into SQLite tables.
Connect and Create a Cursor
In loader.py we already the steps 1 and 2 covered. However we’re going to add some error handling.
try:
    # Connect to the database
    conn = sqlite3.connect('stats.db')
    cursor = conn.cursor()
except sqlite3.Error as e:
    # If things go wrong
    print("Error connecting to the database:", e)
So with a good connection we can move to executing some SQL. This will create our table for the data.
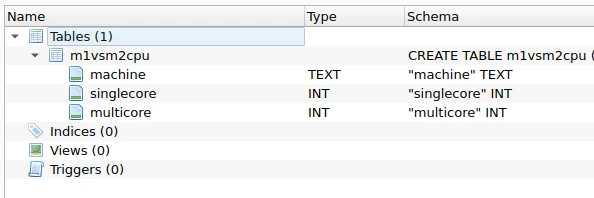
Create Our Table With SQL and Commit
# Create a table
try:
    cursor.execute('''
        CREATE TABLE IF NOT EXISTS m1vsm2cpu (
            machine TEXT UNIQUE,
            singlecore INT,
            multicore INT
        )
    ''')
    conn.commit()

except sqlite3.Error as e:
    # If things go wrong
    print("Error creating table:", e)
You may notice we commit the data here. This fulfills step 5.
Awesome, time to load some data!
Read in data from CSV
Now we need to read our data. We will open the m1-vs-m2-cpu.csv into a file handler, and use next() to iterate through it.
Then we’ll do an additional loop for each line in the file, take the data in that line and insert it.
Let’s give it a go.
try:
    with open('csv/m1-vs-m2-cpu.csv', 'r') as file:
        # Skip the first line (header)
        next(file)

        # Insert each row of data into the database
        for line in file:
            machine, singlecore, multicore = line.strip().split(',')
            cursor.execute('''
                INSERT OR IGNORE INTO m1vsm2cpu (machine, singlecore, multicore)
                VALUES (?, ?, ?)
            ''', (machine, int(singlecore), int(multicore)))
Then, we’ll commit the data:
conn.commit()
and display an error message if we get one:
except sqlite3.Error as e:
    print("Error inserting data into the database:", e)
Now for step 6, we’ll close the database.
conn.close()
This will create a table, and insert data for our first .csv file. If we run it, we should see no output from the script. If you check the database, there should be a table there now.
And if we check for our data, what do we see?
Awesome!
You may have noticed something in the SQL that’s important to point out. When I created the table for the machine field, I put a UNIQUE keyword on it:
machine TEXT UNIQUE,
This way the key is always unique. Then for the insert statement, I added INSERT OR IGNORE to the statement:
cursor.execute('''
                INSERT OR IGNORE INTO m1vsm2cpu (machine, singlecore, multicore)
                VALUES (?, ?, ?)
            ''', (machine, int(singlecore), int(multicore)))
The reason for this is simple: I want to be able to run this script multiple times without adding a new record every time. INSERT OR IGNORE will only add rows if they’re not already there. That comes in handy when we need to run this script multiple times.
So now we have our first table created. Here’s the code to add the rest of them:
m1-vs-m2-compute.csv
Create code:
cursor.execute('''
        CREATE TABLE IF NOT EXISTS m1vsm2compute (
            machine TEXT UNIQUE,
            computescore INT
        )
    ''')
    conn.commit()
Insert code:
with open('csv/m1-vs-m2-compute.csv', 'r') as file:
    # Skip the first line (header)
    next(file)

    # Insert each row of data into the database if it does not already exist
    for line in file:
        machine, computescore = line.strip().split(',')
        cursor.execute('''
            INSERT OR IGNORE INTO m1vsm2compute (machine, computescore)
            VALUES (?, ?)
        ''', (machine, int(computescore)))

conn.commit()
all-geekbench-cpu.csv
Create code:
cursor.execute('''
    CREATE TABLE IF NOT EXISTS allgeekbenchcpu (
        machine TEXT UNIQUE,
        singlecore INT,
        multicore INT
    )
''')
conn.commit()
Insert code:
with open('csv/all-geekbench-cpu.csv', 'r') as file:
    # Skip the first line (header)
    next(file)

    # Insert each row of data into the database if it does not already exist
    for line in file:
        machine, singlecore, multicore = line.strip().split(',')
        cursor.execute('''
            INSERT OR IGNORE INTO allgeekbenchcpu (machine, singlecore, multicore)
            VALUES (?, ?, ?)
        ''', (machine, int(singlecore), int(multicore)))

conn.commit()
all-geekbench-compute.csv
Create code:
cursor.execute('''
    CREATE TABLE IF NOT EXISTS allgeekbenchcompute (
        machine TEXT UNIQUE,
        computescore INT
    )
''')
conn.commit()
Insert code:
with open('csv/all-geekbench-compute.csv', 'r') as file:
    # Skip the first line (header)
    next(file)

    # Insert each row of data into the database if it does not already exist
    for line in file:
        machine, computescore = line.strip().split(',')
        cursor.execute('''
            INSERT OR IGNORE INTO allgeekbenchcompute (machine, computescore)
            VALUES (?, ?)
        ''', (machine, int(computescore)))

conn.commit()
Awesome, now we have our files loaded into the database. In DB Browser, you should see this:
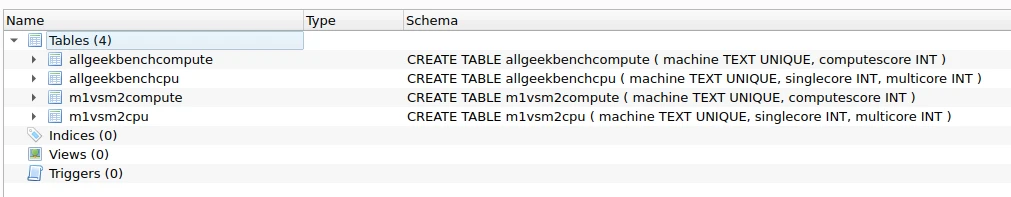
And you can verify there is data in each table:
SELECT * FROM m1vsm2cpu

SELECT * FROM m1vsm2compute

SELECT * FROM allgeekbenchcpu

SELECT * FROM allgeekbenchcompute
Now we have our data and we’re ready to go!
Step 4: Pulling Data from SQLite into Matplotlib
We have a SQLite database with data in it and need to load it into matplotlib. Easy.
Let’s create a new Python script named showdata.py. First we’ll import the libraries:
import sqlite3
import matplotlib.pyplot as p
Then we’ll create the database connection:
# Open the database
try:
    conn = sqlite3.connect('stats.db')
    cursor = conn.cursor()
except sqlite3.Error as e:
    # If things go wrong
    print("Error connecting to the database:", e)
Now we’re ready to pull the data we need.
m1vsm2cpu database
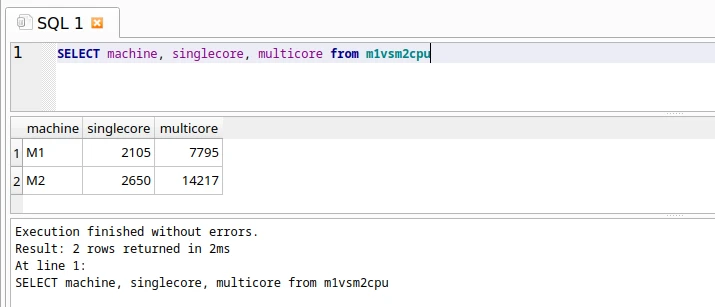
We need to create a SQL statement to access the data. We’ll start with the m1vsm2cpu database.
We’ll send the query with cursor.execute() and then fetch the data with cursor.fetchall(). The fetchall function will return a list of tuples from the database.
try:
    # Retrieve data from the m1vsm2cpu table
    cursor.execute('SELECT machine, singlecore, multicore FROM m1vsm2cpu')
    results = cursor.fetchall()
Now we have a list of tuples in results[]. We can separate this data into 3 lists, to feed to matplotlib.
machines = [result[0] for result in results]
singlecores = [result[1] for result in results]
multicores = [result[2] for result in results]
We need Matplotlib to create a new figure and a set of subplots within it. We can create a figure object, that’s an array axes which are the individual subplots.
fig, ax = plt.subplots()
Then we need to find out how many machines are in our dataset. These are rows from the database.
x = range(len(machines))
Next, we’ll define the width of our bars in the bar graph. After playing around with it, I decided to make it take up 35% of its alloted space.
width = 0.35
Then, we’ll create a bar plot for the figure.
The bar function takes the following parameters:
- The x-coordinates of the bars
- The heights of the bars
- The width of the bars
- Optional parameters such as the color, label, and edge color of the bars
Here are the bar plots for ours. We use the data we retrieved to determine the size of the bars:
ax.bar([i - width/2 for i in x], singlecores, width, label='Singlecore')
ax.bar([i + width/2 for i in x], multicores, width, label='Multicore')
Then we need to add some data for the figure. We’ll set the ticks to the amount of machines we have (2) and then add our labels.
ax.set_xticks(x)
    ax.set_xticklabels(machines)
    ax.set_title('M1 vs M2 CPU Performance')
    ax.set_xlabel('Machine')
    ax.set_ylabel('Score')
Finally, we build the legend and show the image:
ax.legend()
plt.show()
Let’s close out our script by adding the exception handler and closing the connection:
except sqlite3.Error as e:
    print("Error retrieving data from the database:", e)

conn.close()
And now it’s ready to run!
Tada! Congrats! You made a Matplot graph from data in a SQLite Database!
Adding in the other tables
To draw graphs for the other tables, you’ll need to use the following code:
m1vsm2compute table
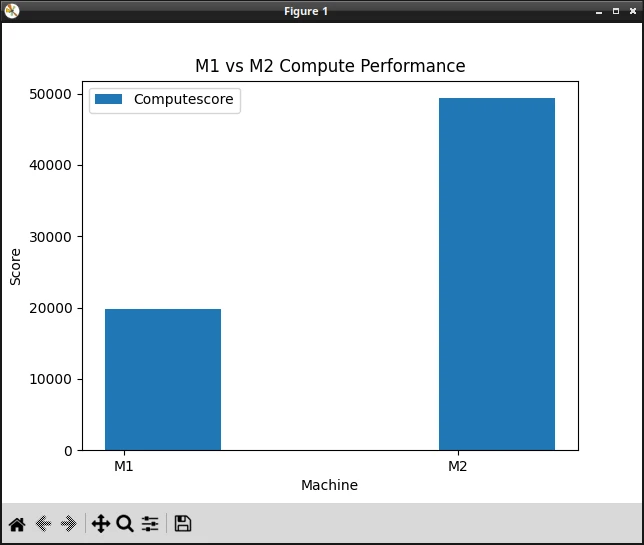
The code:
# Retrieve data from the m1vsm2compute table
    cursor.execute('SELECT machine, computescore FROM m1vsm2compute')
    results = cursor.fetchall()

    # Separate the data into two lists: machines and computescores
    machines = [result[0] for result in results]
    computescores = [result[1] for result in results]

    # Create a bar graph of the computescores data
    fig, ax = plt.subplots()
    x = range(len(machines))
    width = 0.35
    ax.bar([i - width/2 for i in x], computescores,
           width, label='Computescore')
    ax.set_xticks(x)
    ax.set_xticklabels(machines)
    ax.set_title('M1 vs M2 Compute Performance')
    ax.set_xlabel('Machine')
    ax.set_ylabel('Score')
    ax.legend()
    plt.show()
allgeekbenchcpu table
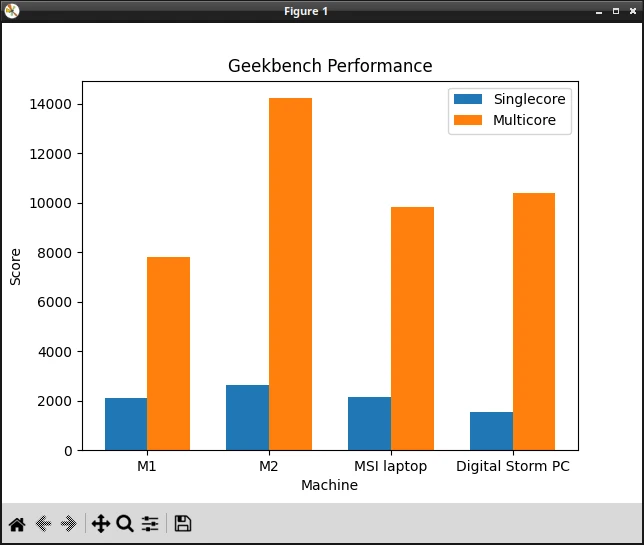
    # Retrieve data from the allgeekbenchcpu table
    cursor.execute(
        'SELECT machine, singlecore, multicore FROM allgeekbenchcpu')
    results = cursor.fetchall()

    # Separate the data into three lists: machines, singlecores, and multicores
    machines = [result[0] for result in results]
    singlecores = [result[1] for result in results]
    multicores = [result[2] for result in results]

    # Create a bar graph of the singlecores and multicores data
    fig, ax = plt.subplots()
    x = range(len(machines))
    width = 0.35
    ax.bar([i - width/2 for i in x], singlecores, width, label='Singlecore')
    ax.bar([i + width/2 for i in x], multicores, width, label='Multicore')
    ax.set_xticks(x)
    ax.set_xticklabels(machines)
    ax.set_title('Geekbench Performance')
    ax.set_xlabel('Machine')
    ax.set_ylabel('Score')
    ax.legend()
    plt.show()
allgeekbenchcompute table
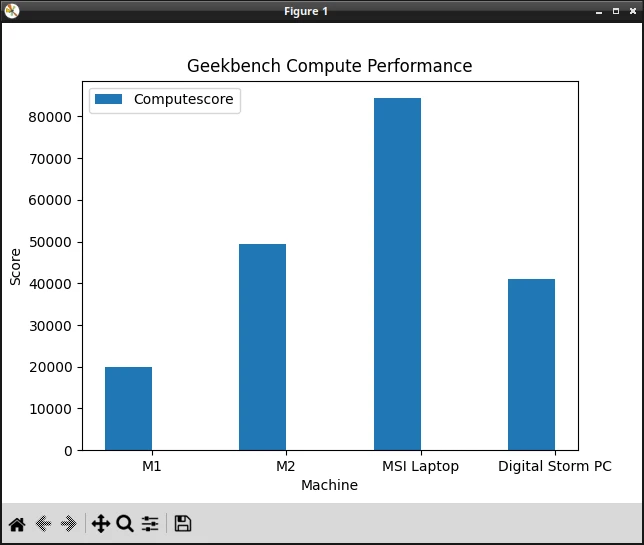
# Retrieve data from the allgeekbenchcompute table
    cursor.execute('SELECT machine, computescore FROM allgeekbenchcompute')
    results = cursor.fetchall()

    # Separate the data into two lists: machines and computescores
    machines = [result[0] for result in results]
    computescores = [result[1] for result in results]

    # Create a bar graph of the computescores data
    fig, ax = plt.subplots()
    x = range(len(machines))
    width = 0.35
    ax.bar([i - width/2 for i in x], computescores,
           width, label='Computescore')
    ax.set_xticks(x)
    ax.set_xticklabels(machines)
    ax.set_title('Geekbench Compute Performance')
    ax.set_xlabel('Machine')
    ax.set_ylabel('Score')
    ax.legend()
    plt.show()
Saving the images
If you want to save these images, it’s super easy.
Just add this to the code:
fig.savefig('yourimagename.png')
Conclusion
Congratulations! You’ve successfully navigated this long tutorial. You have learned how to harness Python, SQLite, and Matplotlib to gather, store, and visualize data in an efficient and captivating manner. By now, you should be feeling confident enough to tackle any data-related challenge that comes your way.
If you build something cool, let me know! I make stuff like this on my Python livestream every week, so be sure to check it out.
Remember, the skills you’ve developed throughout this tutorial are just the tip of the iceberg. The world of data science and visualization is vast and ever-evolving. Stay curious, keep exploring, and never stop learning to unleash your full potential in this exciting field.

Skip the hype. The newsletter that keeps you in the know.
AI news curated for engineers. The AI New Hotness Newsletter is what you need.
Zero fluff. Just the research, tools, and infra updates that actually affect your production stack.
Stay up to date on AI for developers - Subscribe on LinkedIn
