


Getting Started with Adafruit IO

Jeremy Morgan 
Dec 26, 2015 - 6 min read
Last Update: Dec 31, 2022

AI changed software development. This is how the pros use it.
Written for working developers, Coding with AI goes beyond hype to show how AI fits into real production workflows. Learn how to integrate AI into Python projects, avoid hallucinations, refactor safely, generate tests and docs, and reclaim hours of development time—using techniques tested in real-world projects.
There is an updated article showing the features of Adafruit IO here Check it out!
Earlier this year Adafruit Industries put their IoT dashboard Adafruit.IO into Beta, and it looks pretty cool. I’ll show you how to set up a dashboard using one of my mini weather station designs for data input. You may remember this project from a few months ago. I’ll be adding yet another endpoint to the project on Adafruit.IO.
Setting up the Feeds
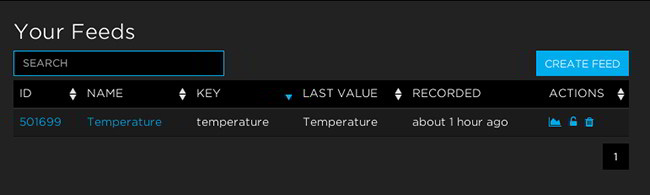
Adafruit IO uses “feeds” for the data used in your dashboard. This feed contains the raw data you’ll be looking at, such as a temperature reading. This data can be populated through a REST API, Python, Ruby, and NodeJS clients, or uploading a .csv. I’m going to be using the REST Api called from a Python script in this project.
The first step is to create a feed:
After creating it you’ll be given a chance to edit some metadata:
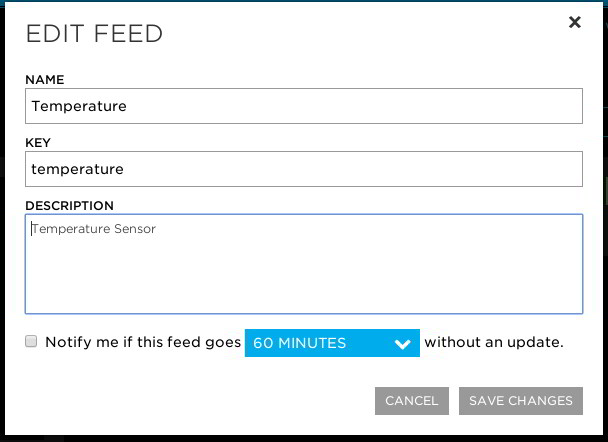
After your feed is created, you can edit attributes such as:
- Name
- Description
- License
- Public / Private setting
This is pretty neat because you can make your feeds public, and specify how you would like them used. If this service gains a big following this opens a ton of doors for us.
In my case I set up feeds for each piece of data I want on my dashboard that will come from the Raspberry Pi with the corresponding sensors wired up:
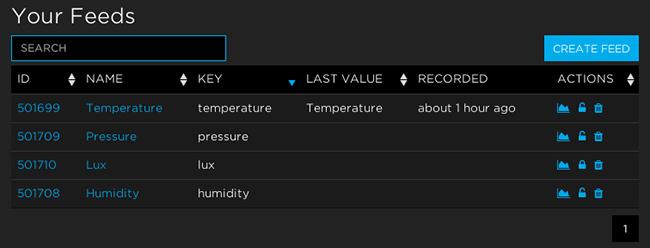
Next I’ll show you how I populated them.
Working with the Feed API
For this project we’re going to use the feed REST API. You can find full documentation here. I won’t go into great detail with interacting with the API, but instead explain what I’ve done so far. I encourage you to dig into it and take a look.
First, the base URL is:
Let’s send a few requests to it and see how it works.
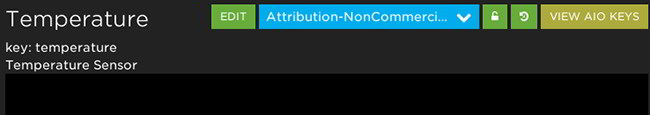
Note: You will need your AIO key for all requests, you can get this key in the upper right hand corner of your feed view with the “View AIO keys” button:
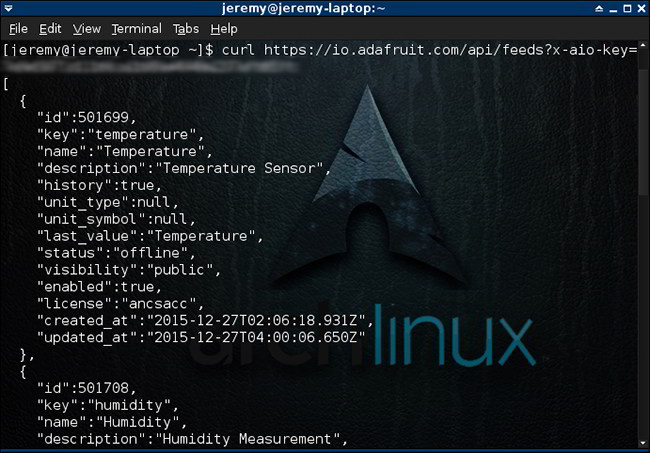
To send a simple request, I’ll use CURL to test it out. I sent the following command:
curl https://io.adafruit.com/api/feeds?x-aio-key=[MY AIO KEY]
It shows the following response (showing a list of my feeds)
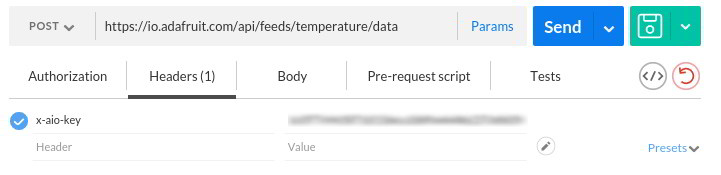
Using similar REST commands, we’ll send data to the feeds. I’ll use Postman for building and testing these commands.
Create a new request in Postman, using the following URL:
Set the x-aio-key header with your key:
and send a form value like so:
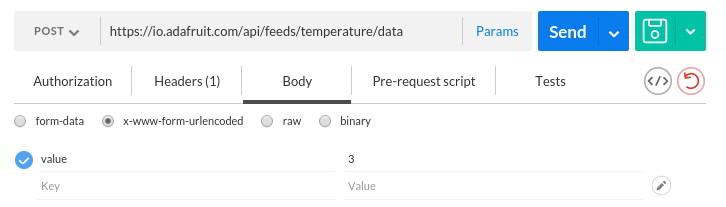
After sending it you should see a result like this:
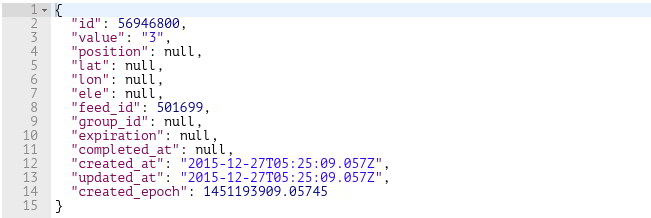
You’ve just sent a piece of data to your feed (I recommend deleting test entries of course). Now we’ll integrate that into the script on the Raspberry Pi that’s gathering data.
Integrating the REST Calls Into the Weather Station
For this part, I’m going to use the code from the Raspberry Pi Mini Weather Station I set up a few months ago. I’ve got this sitting in my garage collecting data (going to both an Azure site and a Python/Linux endpoint) and this will make a nice realtime monitor for it.
If you want to use this code as a base to start, clone it:
git clone https://github.com/JeremyMorgan/Raspberry_Pi_Weather_Station.git
If you want to replicate my results exactly, you’ll want to make sure it’s set up as described in the Raspberry Pi Mini Weather Station project.
Here we’ll open up readings.py, and add “import urllib” to the top, since we’ll be using that in addition to the urllib2 we’ve been using.
Then we’ll add an additional call (for temperature). We start by adding a variable for my AIO key:
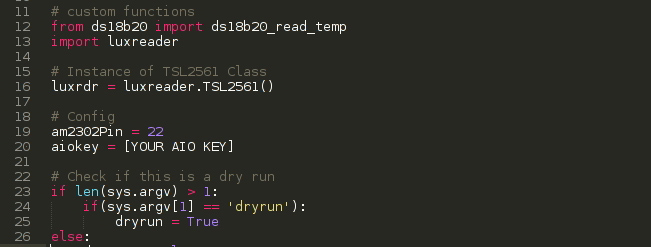
Next we’ll go down add the additional call. Add the URL for the 3rd call here:
url3 = 'https://io.adafruit.com/api/feeds/temperature/data'
Next, let’s create a 3rd request. The data object for this one will be a little different from the others in the file:
ftemp = round((9.0 / 5.0  * avgTemp + 32), 2)
values3 = {'value' : ftemp }
We have converted it to Farenhiet and created a small tuple called “values”
The request for this will be different from the others in the file as well. We’re going to urlencode the value, then add a different content type header, and the aiokey. It will look like this:
data3 = urllib.urlencode(values3)
req3 = urllib2.Request(url3, data3)
req3.add_header('Content-Type','application/x-www-form-urlencoded; charset=UTF-8')
req3.add_header('x-aio-key',aiokey)

response3 = urllib2.urlopen(req3)
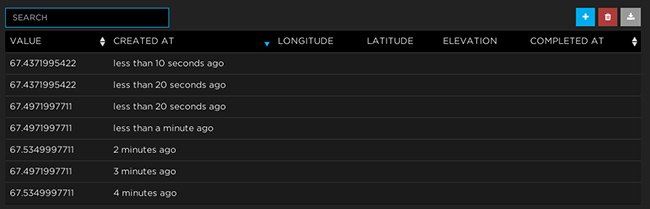
Now, after saving the file you should now be sending data to the endpoint.
You should also see entries for when the data is sent:
Congratulations, you’ve got a feed going! Repeat this process for the other measurements you want to add to your dashboard. I added in the following:
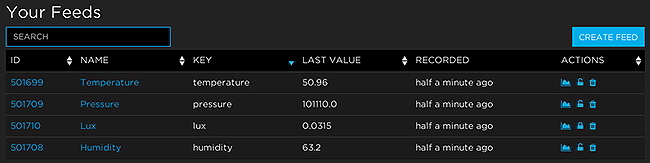
Let’s create a dashboard next to view the data.
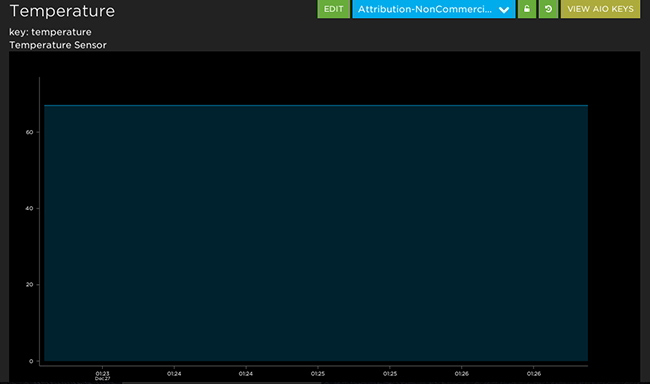
Creating an Adafruit IO Dashboard
Now that you have some feeds gathering info, you can create a dashboard to view it. The dashboard is a customized window into your data, and you can use as many or as few of your feeds. Create a new dashboard and take a look at the options available:
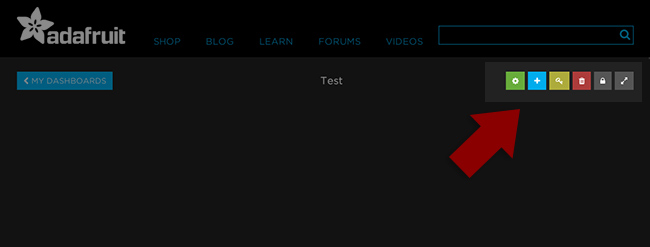
- Edit your dashboard blocks and layout
- Create a new block
- View your secret AIO key
- Delete Dashboard
- Set privacy
When you create a new block, you’re greeted with a list of options:
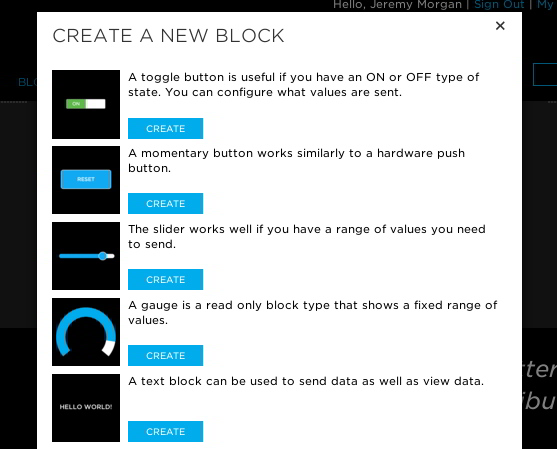
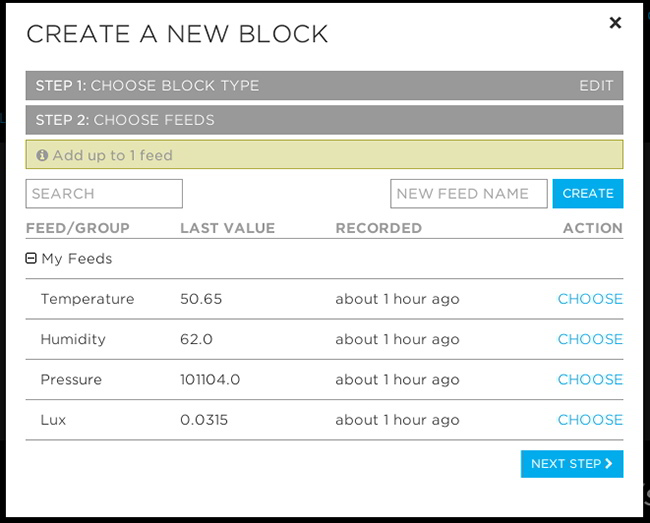
Once you choose one (for instance I chose the gauge) you can modify some of the options, and select the feed.
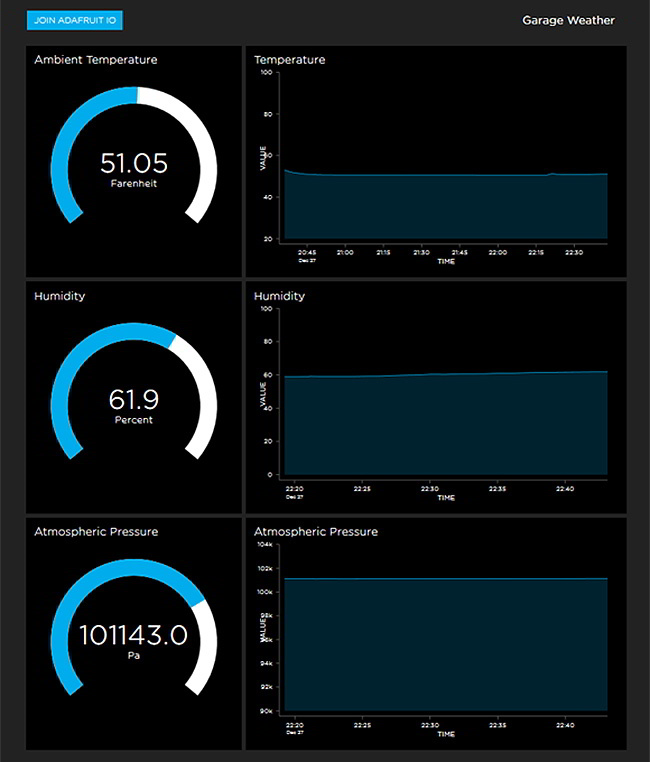
It’s that easy to set up. You create a set of blocks, and put together your dashboard.
Take a look at my Garage Dashboard
Conclusion: My Impressions
One key thing to keep in mind if you’ll be using this service: it’s still in beta. It’s not yet ready for production use. That being said it does appear to be functioning quite well. I had a few issues sizing up boxes and rendering the dashboard in Chrome under Arch Linux, but opened it up in Firefox and it was fine. These were the only minor problems I ran into. I got set up pretty fast and it looks great, so I’d recommend checking it out.
The good points:
- Several options to interface data
- REST API well structured and useful
- Great documentation
- Easy to use and set up
- Visually appealing
So if you’d like a cool dashboard to augment your project or want to share some data go check it out. It’s well worth a couple hours of playing.
Want to learn more about the Raspberry Pi? Check out the Raspberry Pi for Developers course!

Skip the hype. The newsletter that keeps you in the know.
AI news curated for engineers. The AI New Hotness Newsletter is what you need.
Zero fluff. Just the research, tools, and infra updates that actually affect your production stack.
Stay up to date on AI for developers - Subscribe on LinkedIn