


How Hot Does it Get Inside a Car During a Heat Wave?

Jeremy Morgan 
Jul 11, 2021 - 7 min read
Last Update: Jun 7, 2024

AI changed software development. This is how the pros use it.
Written for working developers, Coding with AI goes beyond hype to show how AI fits into real production workflows. Learn how to integrate AI into Python projects, avoid hallucinations, refactor safely, generate tests and docs, and reclaim hours of development time—using techniques tested in real-world projects.
An unprecedented heat wave rocked the Pacific Northwest in June. Oregon turned into an oven. This gave me yet another reason to break out a Raspberry Pi and collect some data. I sent it to Adafruit because it remains one of the greatest places to send and look at IoT data.
During the first day I placed a Raspberry Pi under my deck to collect and send temperature and humidity data.
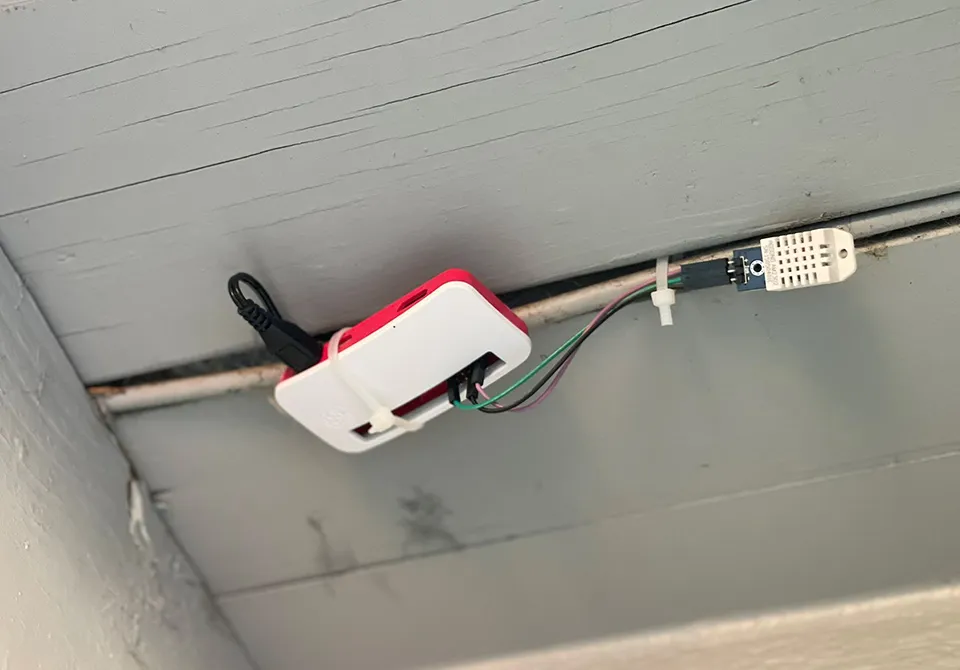
I wanted to get the ambient air temperature as accurately as possible. I placed the Raspberry Pi (Zero) under the deck so it wouldn’t be in direct sunlight. It’s in the shade 24/7. Joists block the breeze.
Then my son had an incredible idea:
Let's put a sensor in a car to see how hot it gets inside the cabin.
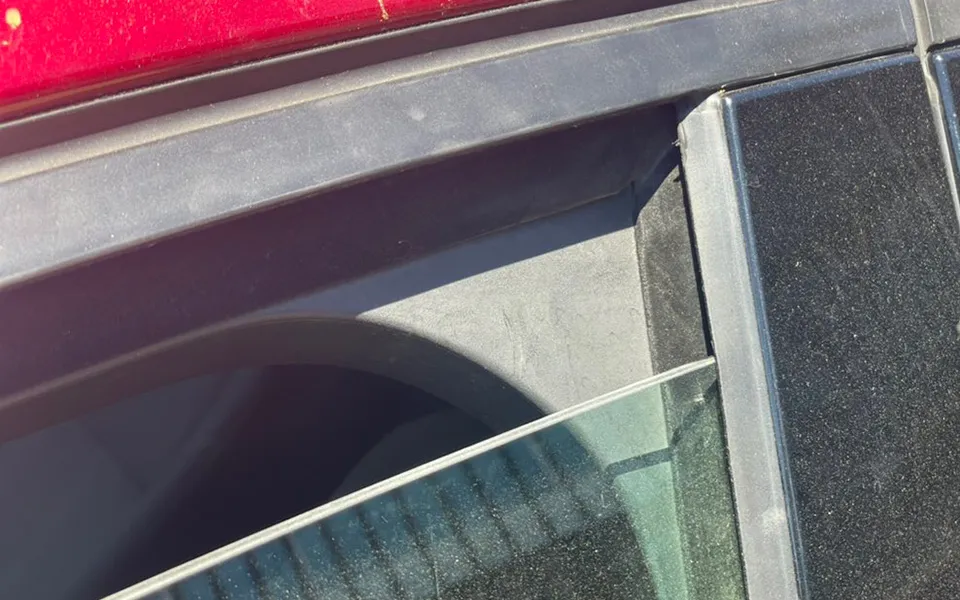
Great! So I set up a 2nd Raspberry Pi for that purpose. I put it in the center console of our Ford Focus. I didn’t want that one in direct sunlight, either. The car itself was in direct sunlight the entire time. I parked it in an area where it didn’t receive shade.
I cracked open each window about 2 inches:
Then measured the results over a few days.
In this article, I’ll show you how we built this setup and the data I found.
You can skip to this section if you only want to see the results.
Step 1: Setting up the Raspberry Pis
To gather and send this data, I used two Raspberry Pis set up identically.
Under the Deck (Outside Temperature)
- Raspberry Pi Zero W
- AM2302 Temperature and Humidity Sensor
- Raspberry Pi OS
- Python Script using Adafruit DHT Circuit Library
Inside the car
- Raspberry Pi 3
- AM2302 Temperature and Humidity Sensor
- Raspberry Pi OS
- Python Script using Adafruit DHT Circuit Library
I wired up the sensors like so:

They were both set up with these instructions if you’d like to try it yourself.
I even did a live stream when I set up the pi in the car if you want to see it in action.
Step 2: Gathering the Data
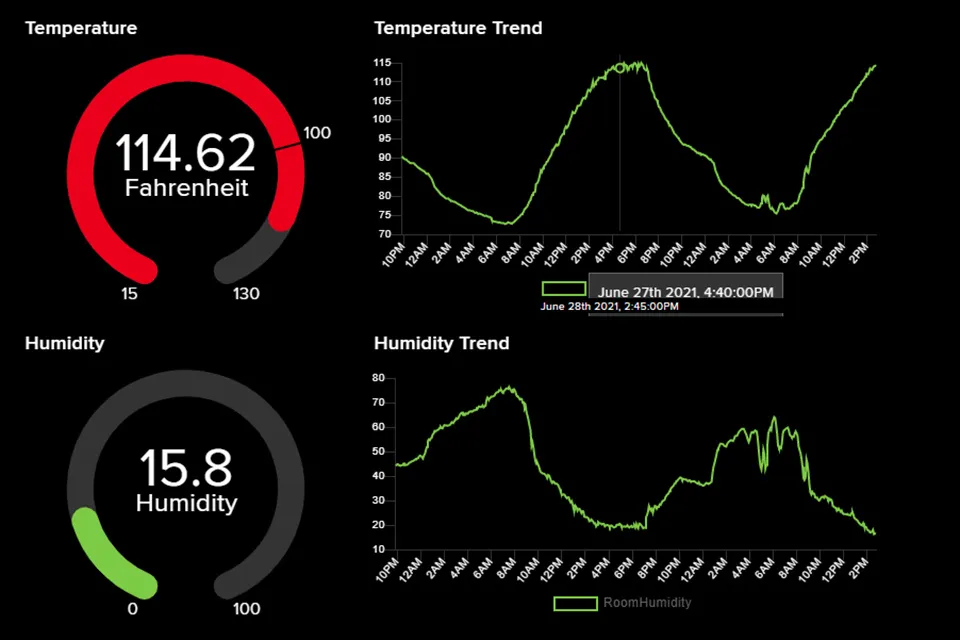
I sent the data to Adafruit and let it collect data for a few days. Adafruit gave me some nice realtime graphs to look at:
This was great for realtime data. Setting this up is very easy. Again I cover how to send data to Adafruit and set up a dashboard.
While the dashboards are neat, I wanted to take the entire data set and look at it. The dashboards only show a 24-hour window, but Adafruit collects the data, and you can export it to JSON or CSV.
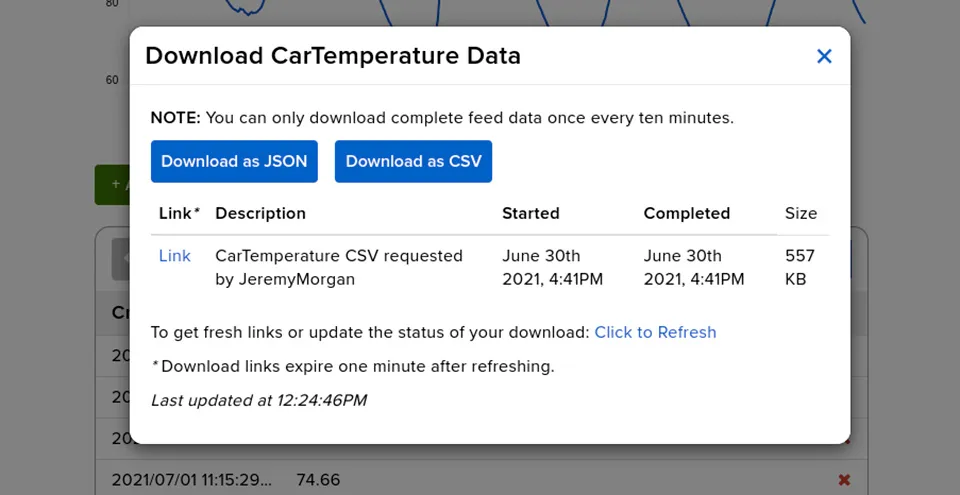
So I exported the data for the few days into CSV files. I could browse through them, and spot check things, but I wanted to merge all the data. I decided to drop them into a SQLite database to do that.
Step 3: Processing the Data
I had a few issues right off the bat when dropping these into a database.
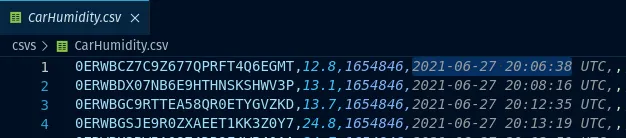
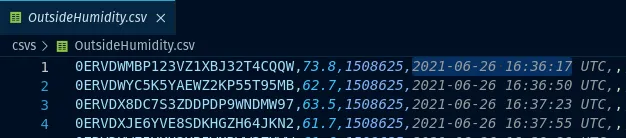
- I have four separate feeds of information:
- Outside temperature
- Outside humidity
- Car temperature
- Car Humidity
I had to consolidate them into a single database. Which created another issue:
- The samples were all taken at slightly different times.
The sensors took samples every thirty seconds. The two Raspberry Pis were not synchronized, and there was some clock drift.
Since the timestamps showed that sensors never took temperatures at the same time, I would have to sacrifice some precision.
I tackled this problem live on my Twitch stream. I round off the seconds and use that timestamp as an index for the values.
timestamp := records[i][3][:len(records[i][3])-4]
seconds, err := strconv.Atoi(string(timestamp[len(timestamp)-2:]))

if err != nil {
  log.Printf("Error: %v", err)
}

if seconds >= 30 {
  timestamp = timestamp[:len(timestamp)-2] + "30"
} else {
  timestamp = timestamp[:len(timestamp)-2] + "00"
}

ourValue, err := strconv.ParseFloat(records[i][1], 64)
I wrote a Go program live on stream that did the following:
- Read in CSV files (one per data stream)
- Stored them in Sqlite
First, I took the CSV with the fewest records in it. That way, I knew we would have the most overlapping values. Some data streams were longer but wouldn’t have values in the smaller streams. So this was the starting point.
I read in that file and created a table with the timestamp, and the value included. The timestamp would be our index.
func FirstInsert(db *sql.DB, timestamp string, value float64) (bool, error) {

	insertReadingSql := `INSERT INTO Reading (TimeStamp, CarTemperature) VALUES (?,?)`

	statement, err := db.Prepare(insertReadingSql)

	if err != nil {
		log.Println("Failed to prepare SQL Statement")
		return false, err
	}

	_, err = statement.Exec(timestamp, value)

	if err != nil {
		log.Println("Failed to insert data")
		log.Printf("Timestamp: %v \n Value: %v \n", timestamp, value)
		return false, err
	}

	return true, nil
}
Then for the subsequent feeds, I read in each of those .CSVs and inserted values to the corresponding timestamps:
func InsertData(db *sql.DB, columnname string, timestamp string, value float64) (bool, error) {

	updateReadingSql := `UPDATE Reading SET ` + columnname + ` =? WHERE TimeStamp = ?`

	statement, err := db.Prepare(updateReadingSql)

	if err != nil {
		log.Println("Failed to prepare SQL Statement")
		return false, err
	}
	_, err = statement.Exec(value, timestamp)

	if err != nil {
		log.Println("Failed to insert data")
		return false, err
	}

	return true, nil
}
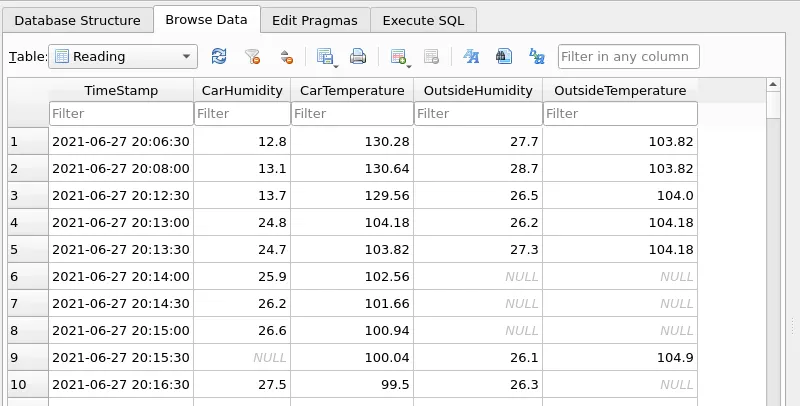
And in the end, I had a nice SQLite database with the values I needed.
You can download all this data and the application to process it here.
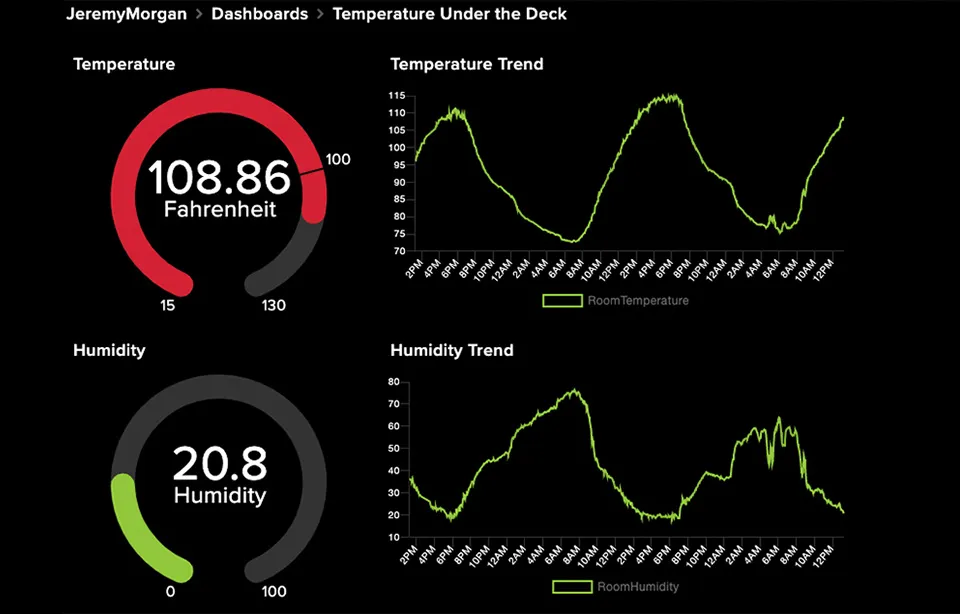
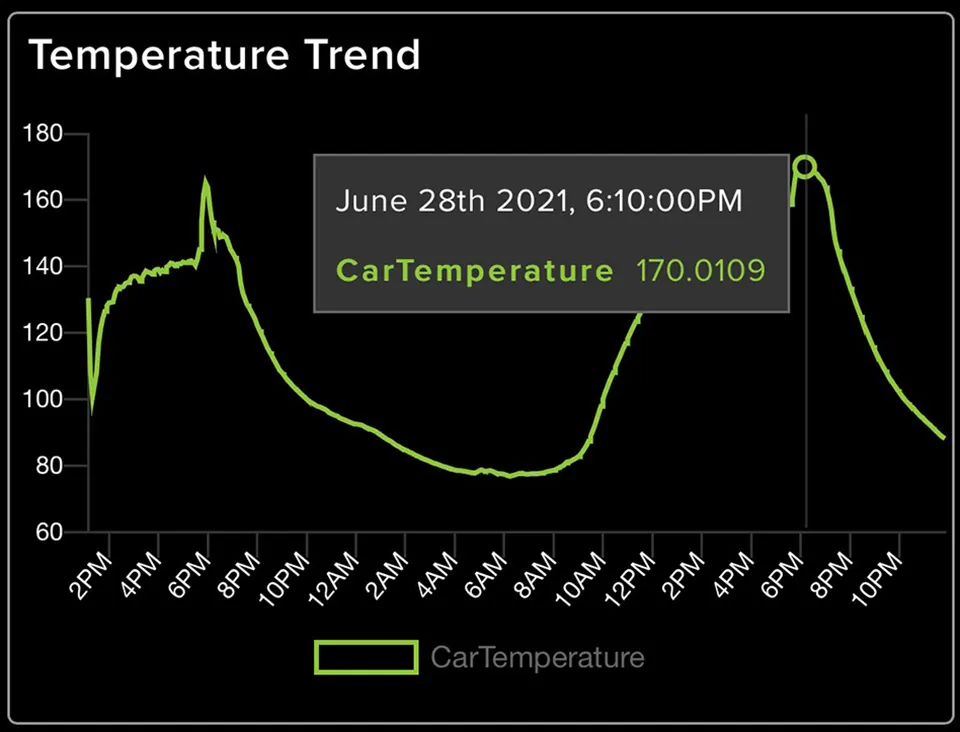
So, How Hot Did it Get??
Now I can dive into the data and get a good handle on how hot it got outside and how hot it was in the car.
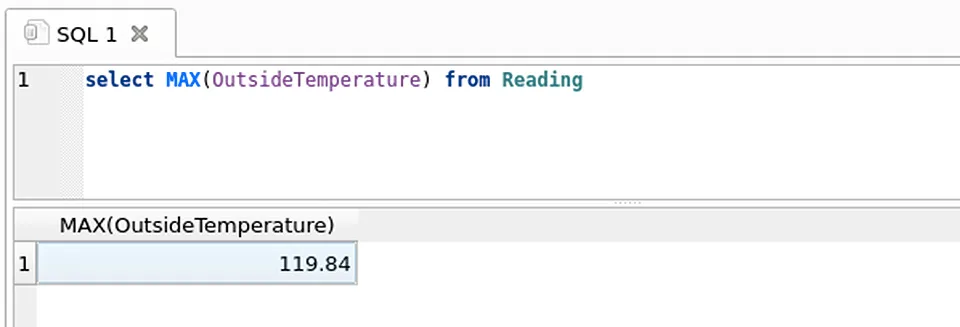
Maximum temperature outside:
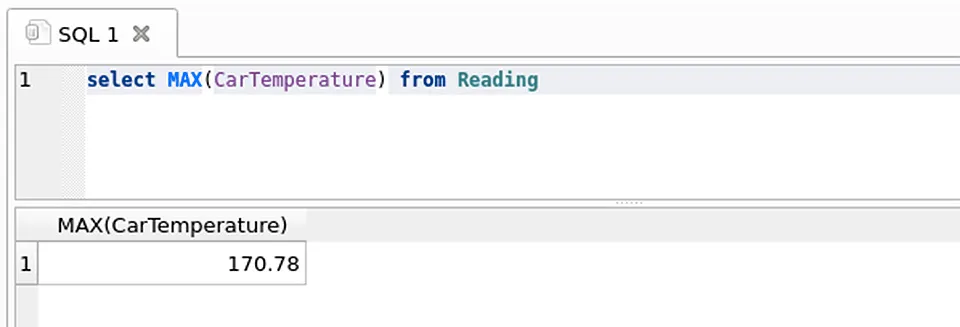
Maximum temperature in the car:
Wow. That was unexpected. And I’d like to match things up a little to see the inverse of each.
The temperature reached its hottest point at 2021-06-29 00:34:30 so, June 29th at 5:34PM.
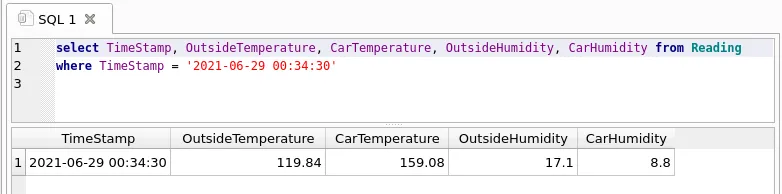
The outside temperature peaked at 119.84 and the temperature inside the car was 159.08. Incredible.
So what about the peak car temperature?
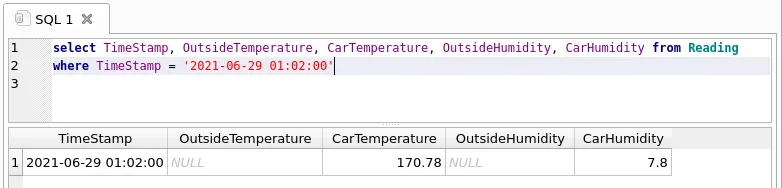
Unfortunately, the outside temperature sensor failed to read during this time, but it was about an hour later and reached 170.78 degrees. This is with windows cracked open. While this was during 100+ temperatures, this is something to consider when you see a child or pet in a car on a hot day.
There are some other things we can look at with this data. Let’s see the relationship between the two temperatures.
Here’s a nice graph of the car temperature vs. outside temperature:
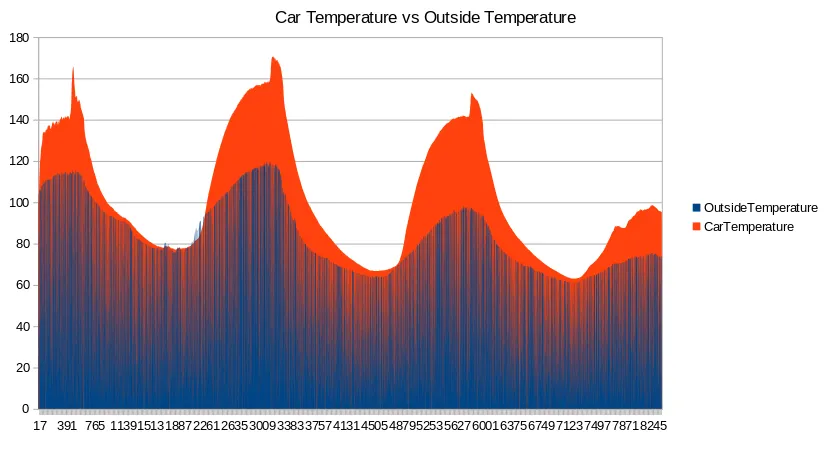
It’s interesting how late at night when things “cooled down” to around 80 degrees, the two temperatures almost equalize. Yet if we zoom in deeper we can visually see how the heat builds in the car:
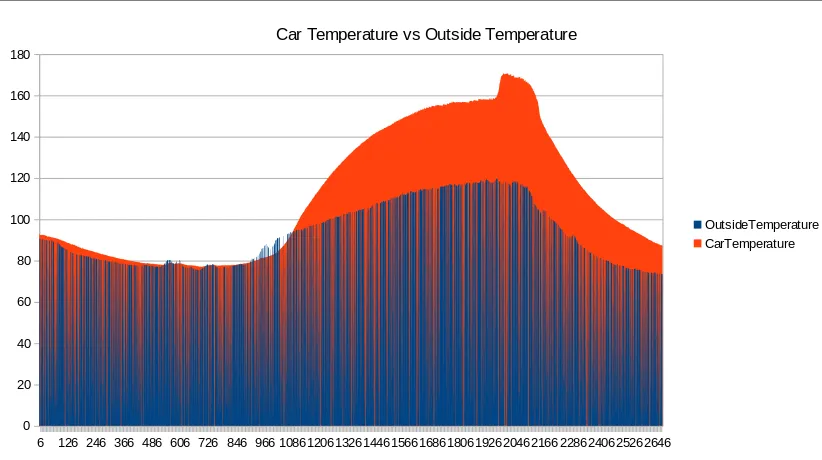
At a certain point, it even appears the car was cooler than the outside temperature.

At midnight the car was a mere two degrees hotter than the outside temperature.
At 5am it was four degrees cooler in the car.
A couple of hours later, it was eight degrees hotter than outside.
Near the day’s peak it was 50 degrees hotter in the car. Incredible.
You can see the peaks and valleys in the graphs.
I’ll be doing even more with this data in the future. Very curious about how it ramped up, and I want to look into it more.
Conclusion
So I’ve always been against leaving children and pets in your car on a hot day. Most of us are. But it’s interesting to see exactly how hot it gets inside a car. This is absolute justification for calling the police when you see it. end rant.
This data is unique in that we measured during 110+ degree days, but you can still see the effects of the car. The only time the car wasn’t hotter than the outside was when the sun wasn’t on it. We can deduce the sun shining through windows (they are not tinted on this car) affects the inside temperature. If it were an 80-degree sunny day I imagine the inside still capable of being 120 degrees or more.
Lesson: We all know cars sitting in the sun get hotter. Now we can see exactly how much hotter.
I wanted to share this data, how I put it together and what the results were. I hope you’ve enjoyed it.
You can download this data and process it yourself. The timestamps are UTC, and I am in the PST region, so keep that in mind. I’m curious to see what others might do with this data.
And be sure to check out some of the live streams I’ve done working on this data.
Questions? Comments? Yell at me!
Want to become an expert Go programmer?

You can boost your skills in a few weekends by taking these high quality Go courses taught by top experts!
We have over 30 hours of Go courses you can take now! You can try it for 10 days free of charge.
Click here for a free trial!

Skip the hype. The newsletter that keeps you in the know.
AI news curated for engineers. The AI New Hotness Newsletter is what you need.
Zero fluff. Just the research, tools, and infra updates that actually affect your production stack.
Stay up to date on AI for developers - Subscribe on LinkedIn